CrimeTime
Python web application for exploring and forecasting crime rates in NYC
This project is maintained by mdh266
CrimeTime
Introduction
This web application was part of a 3 week project at Insight Data Science. I originally started this project because I was interested in developing a data driven approach to reducing crime in the NYC area. Working on this project I quickly noticed that different neighborhoods are affected by different types of crime and these crimes peak at different times of the year (you can see this blog post to read more). I thought if I could make a web application that forecasts monthly crime rates on a local level it might help police redistribute their resources more effectively and thus reduce the crime in NYC. The applicaiton could also be of interest to individuals or business who are concerned about crime rates in their neighborhood.
The application prompts to enter an address from the input page seen below:

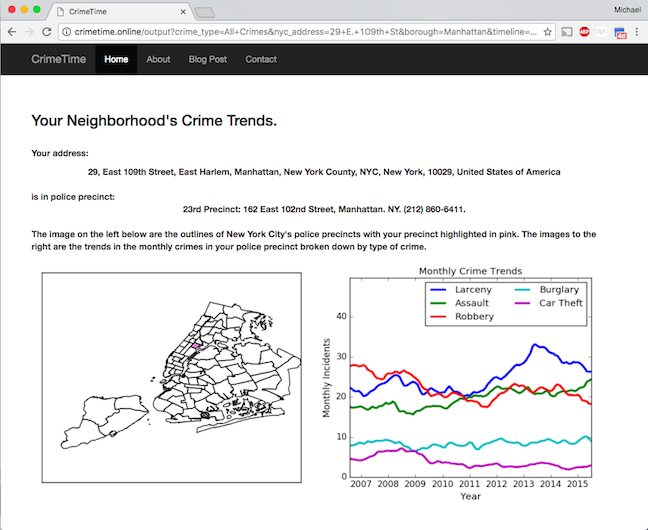
And they get back a report on the historical trends of crimes in their neighborhood:

Users can select specific crimes in their neighborhood and get the historical trend, seasonality, as well as which days and times most of these crimes happen. The results for assault are shown below:

Users can also choose to forecast specific crime rates into the future.
How It works
The source code can be found here.
This code was written using Python and Flask and deployed to Amazon web services. Users are prompted to enter an address and then I use the geopy library to get the latitude and longitude of the address. Once that latitude and longitude are known I use the shapely library to find out which police precinct the address is in and obtain the data on that police precinct.
The info for police precincts was obtained by scraping the NYPD’s website using the beautifulsoup library and also this specific database. The historical crime data was obtained from the NYC Open Data Website and cleaning was completed using Pandas and GeoPandas. The data was then stored in a SQLite database. Forecasted crime rates were predicted using a seasonal ARIMA model through the Python library StatsModels. I used a grid search to obtain the appropriate model paramaters with the selection criteria that the choice of parameters must minimize the validation error.
Running it on your own computer
To run this web application on your computer, please email me to obtain the SQLite
database and install all the necessary dependencies on you computer. You can install all the depencies using Docker by running the following commands from the CrimeTime/ directory:
docker build -t crimetime .
You can then run the application with the command,
docker run -id p 5000:5000 crimetime
Then enter the address http://0.0.0.0:5000/ into your web browser to use the web application.
Alternatively you can use the Anaconda distribution and create an virtual environment using the environment.yml file as described here. And then run the following command from the CrimeTime/ directory:
python tornadoapp.py
and go to the address http://0.0.0.0:5000/ in your web browser.
Building the database
To build the database on your local machine first download the file “NYPD_7_Major_Felony_Incident_Map.csv” from the NYC Open Data website and
place it in the CrimeTime/data/ directory. Then making sure you have all the necessary dependencies installed on your computer (see above) and type the folowing command into your terminal from the CrimeTime/ directory,
python ./backend/PreProcessor.py
NOTE: If NYC Open Data no longer has the file on their website, please email me and I will provide you with the database.
Testing
To test the code to make sure it works run the following command in your terminal shell from the /CrimeTime/directory:
py.test tests
You will then see a report on the testing results.
Documentation
To build the documentation for this code type the following command in terminal from /CrimeTime/ directory:
sphinx-apidoc -F -o doc/ backend/ Then cd into the <code>doc/</code> directory and type,

make html
The html documentation will be in the directory _build/html/. Open the file index.html in that directory.